
Life expectancy can be affected by a variety of factors. About 25% of your lifespan is determined by genetics, according to the National Library of Medicine. Health and wellness habits—like following a balanced, nutrient-rich diet; not smoking; drinking minimal alcohol; maintaining a healthy weight; and staying physically active—can add more than a decade to your life, research from the National Institutes of Health shows. While these factors are significant, another important element that you might not have considered is your environment and community.
While life expectancy generally increases annually in the United States—jumping from about 70.8 years old to 77.5 between 1970 and 2022, according to the Centers for Disease Control and Prevention—this particular metric can vary from state to state or even county to county. In some parts of the country, the average lifespan is getting shorter based on a variety of risk factors on top of health, including socioeconomic factors like poverty, unemployment, income, and education.
According to a 2020 study from researchers at Penn State, West Virginia, and Michigan State Universities, communities with a higher population density, more fast food restaurants, and a high number of extraction industry-based jobs tend to have shorter life expectancies.
To find out how life expectancy varies within North Carolina, Stacker used 2024 County Health Rankings & Roadmaps from the University of Wisconsin Population Health Institute to identify the counties with the shortest life expectancy. Life expectancy measures the average number of years from birth a person can expect to live and is calculated based on the number of deaths in a given time period and the average number of people at risk of dying during that period. Counties with unreliable or insufficient data were excluded from the analysis. Mortality data came from the National Vital Statistics System.
Read on to see if your county is on the list.

Anya Douglas // Shutterstock
#50. Onslow County
- Life expectancy: 75.0 years
--- 1.6 years lower than the state average
Nolichuckyjake // Shutterstock
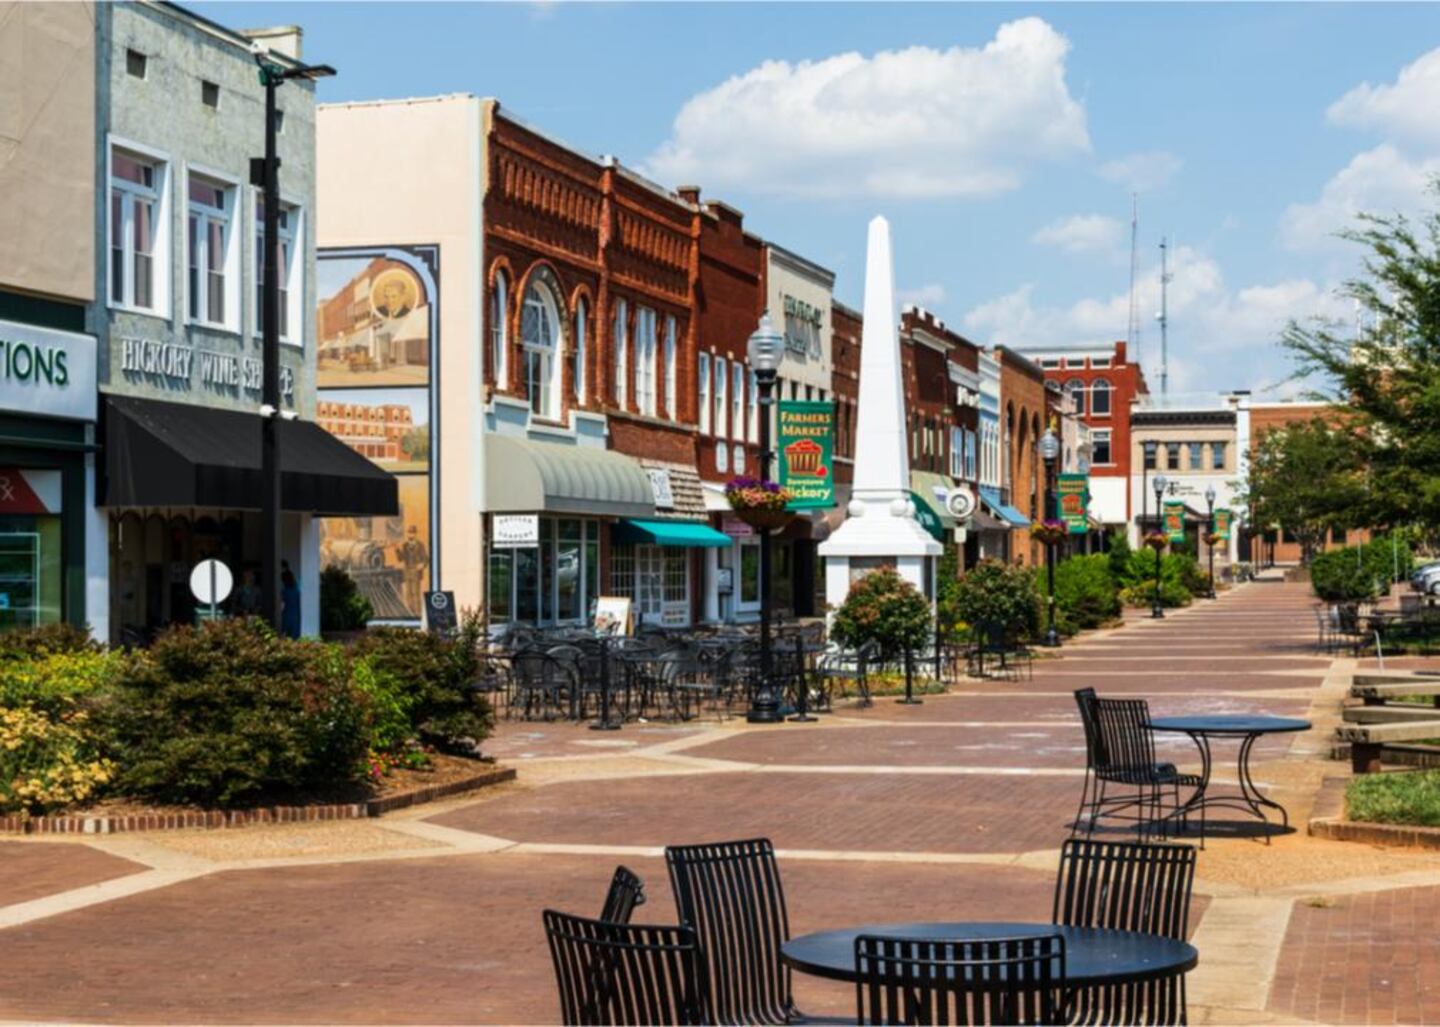
#48. Catawba County (tie)
- Life expectancy: 74.9 years
--- 1.7 years lower than the state average

Canva
#48. Duplin County (tie)
- Life expectancy: 74.9 years
--- 1.7 years lower than the state average

digidreamgrafix // Shutterstock
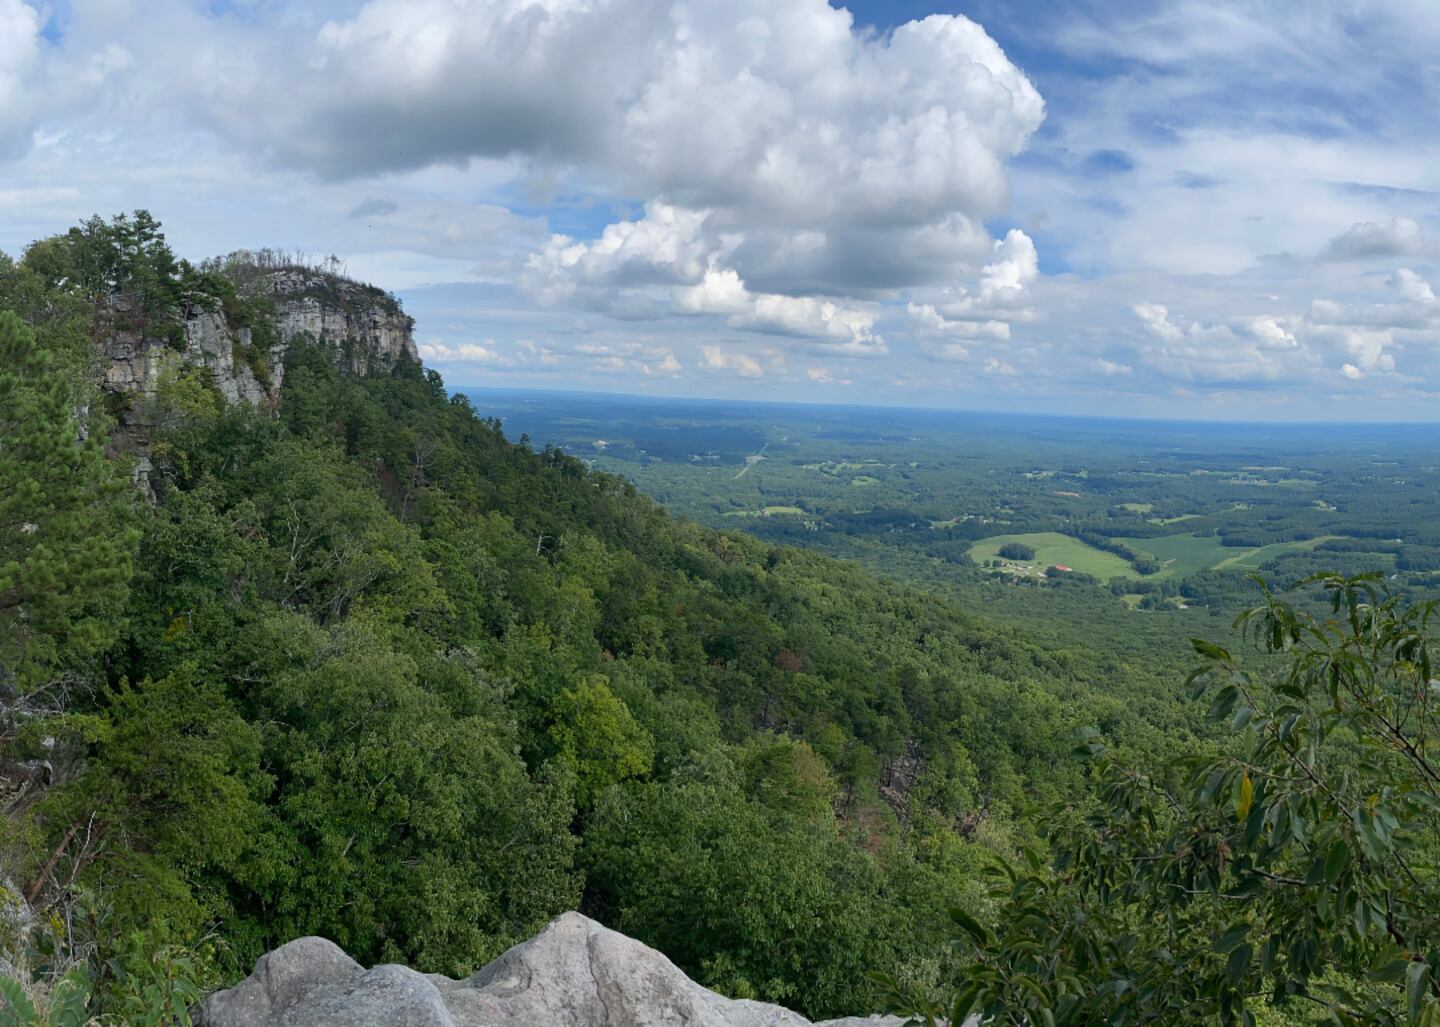
#45. Graham County (tie)
- Life expectancy: 74.8 years
--- 1.8 years lower than the state average

CJ Nunnery // Shutterstock
#45. Lee County (tie)
- Life expectancy: 74.8 years
--- 1.8 years lower than the state average
Kirkam // Shutterstock
#45. Caswell County (tie)
- Life expectancy: 74.8 years
--- 1.8 years lower than the state average
Canva
#44. Craven County
- Life expectancy: 74.7 years
--- 1.9 years lower than the state average

Nolichuckyjake // Shutterstock
#43. Alexander County
- Life expectancy: 74.6 years
--- 2.0 years lower than the state average

James R Poston // Shutterstock
#39. Cherokee County (tie)
- Life expectancy: 74.5 years
--- 2.1 years lower than the state average
Canva
#39. Surry County (tie)
- Life expectancy: 74.5 years
--- 2.1 years lower than the state average

Mary Terriberry // Shutterstock
#39. Wilkes County (tie)
- Life expectancy: 74.5 years
--- 2.1 years lower than the state average

Canva
#39. Chowan County (tie)
- Life expectancy: 74.5 years
--- 2.1 years lower than the state average

Al kearney // Shutterstock
#35. Warren County (tie)
- Life expectancy: 74.4 years
--- 2.2 years lower than the state average

Isaiah N Lilly // Shutterstock
#35. Stanly County (tie)
- Life expectancy: 74.4 years
--- 2.2 years lower than the state average

Canva
#35. Nash County (tie)
- Life expectancy: 74.4 years
--- 2.2 years lower than the state average
mzglass96 // Shutterstock
#35. Yadkin County (tie)
- Life expectancy: 74.4 years
--- 2.2 years lower than the state average
Canva
#30. Pasquotank County (tie)
- Life expectancy: 74.3 years
--- 2.3 years lower than the state average

Canva
#30. Sampson County (tie)
- Life expectancy: 74.3 years
--- 2.3 years lower than the state average

Canva
#30. Davidson County (tie)
- Life expectancy: 74.3 years
--- 2.3 years lower than the state average
Canva
#30. Pamlico County (tie)
- Life expectancy: 74.3 years
--- 2.3 years lower than the state average

MarkVanDykePhotography // Shutterstock
#30. Mitchell County (tie)
- Life expectancy: 74.3 years
--- 2.3 years lower than the state average

Wileydoc // Shutterstock
#27. Wilson County (tie)
- Life expectancy: 73.9 years
--- 2.7 years lower than the state average
Canva
#27. Cumberland County (tie)
- Life expectancy: 73.9 years
--- 2.7 years lower than the state average
Canva
#27. Jones County (tie)
- Life expectancy: 73.9 years
--- 2.7 years lower than the state average
Canva
#25. Hoke County (tie)
- Life expectancy: 73.8 years
--- 2.8 years lower than the state average

Canva
#25. Gaston County (tie)
- Life expectancy: 73.8 years
--- 2.8 years lower than the state average

Canva
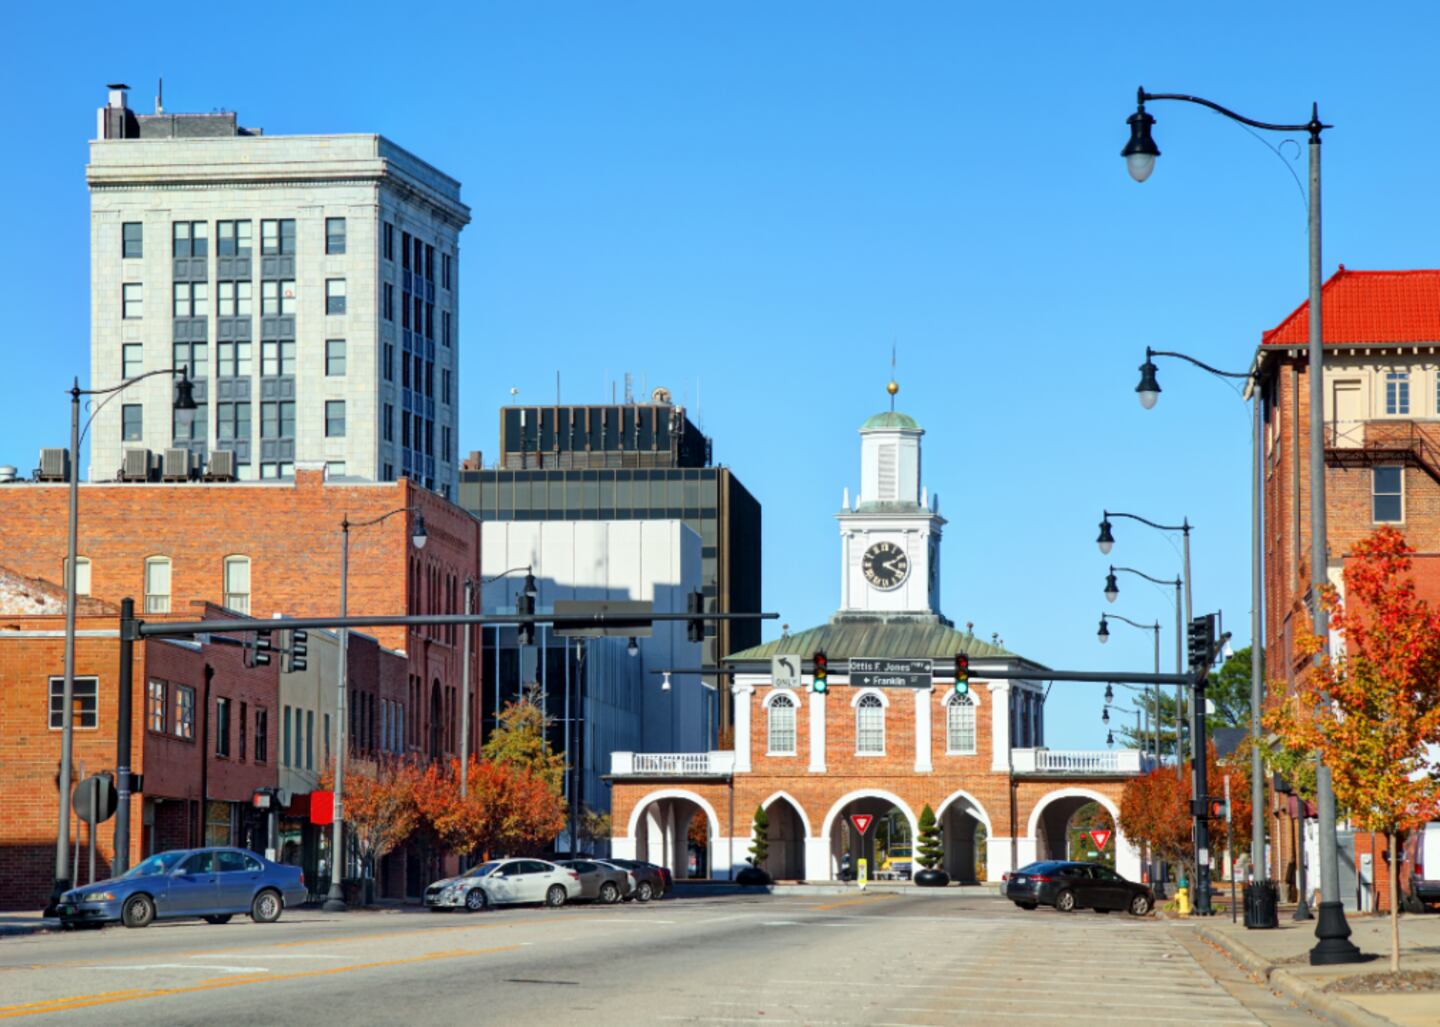
#24. Randolph County
- Life expectancy: 73.7 years
--- 2.9 years lower than the state average

Nolichuckyjake // Shutterstock
#22. Rowan County (tie)
- Life expectancy: 73.6 years
--- 3.0 years lower than the state average

Giulia Carletti // Shutterstock
#22. Wayne County (tie)
- Life expectancy: 73.6 years
--- 3.0 years lower than the state average

SevenMaps // Shutterstock
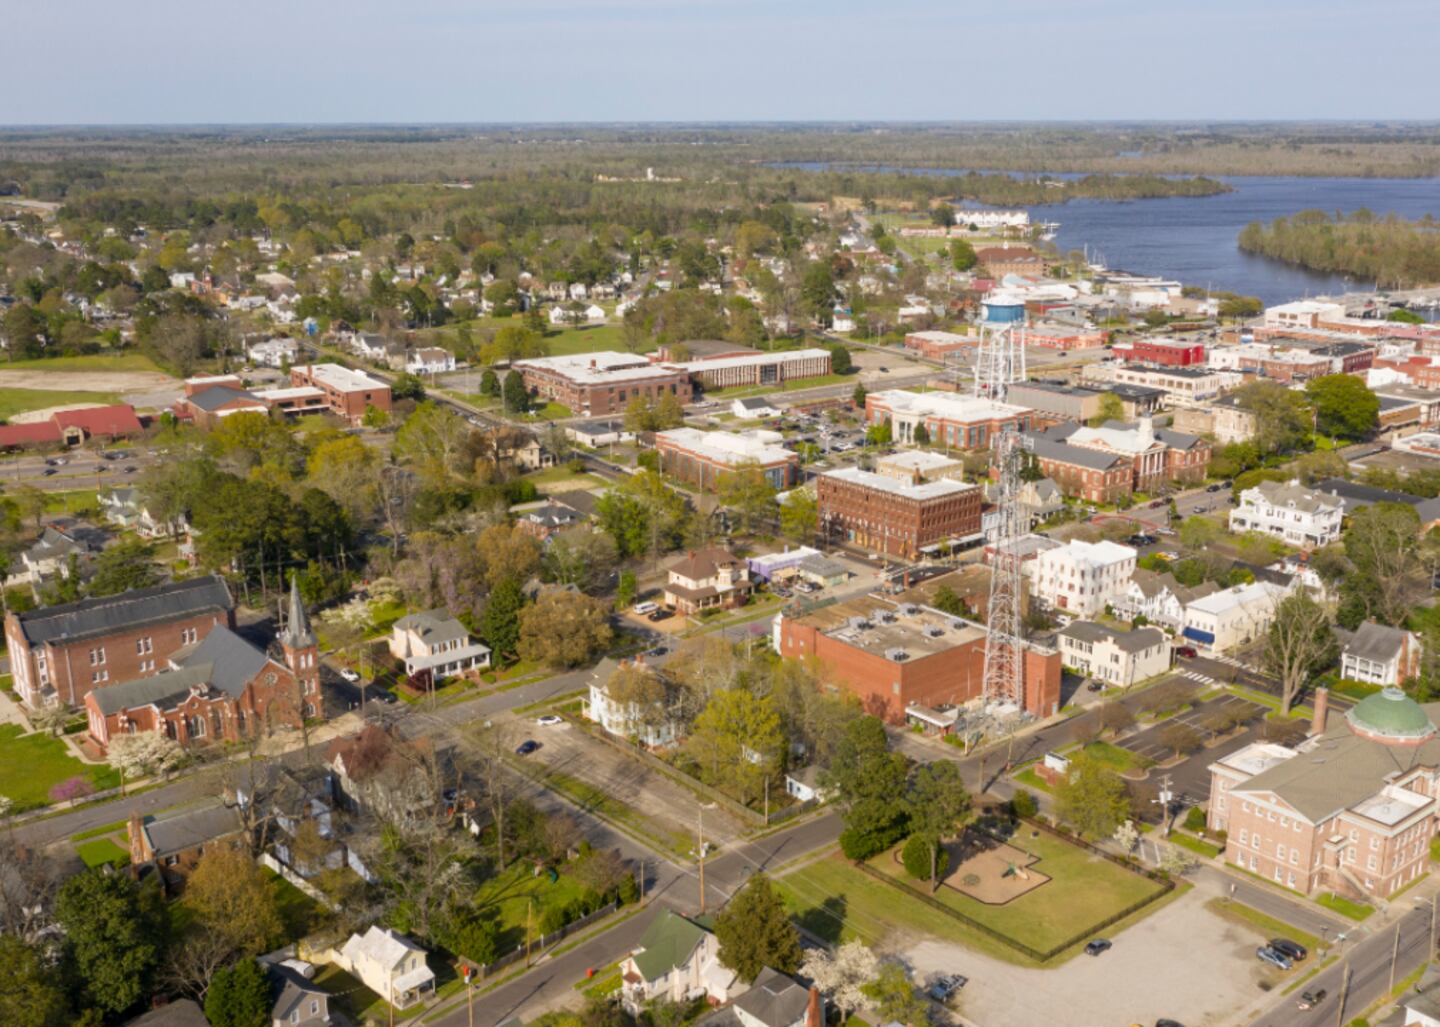
#21. Bertie County
- Life expectancy: 73.5 years
--- 3.1 years lower than the state average
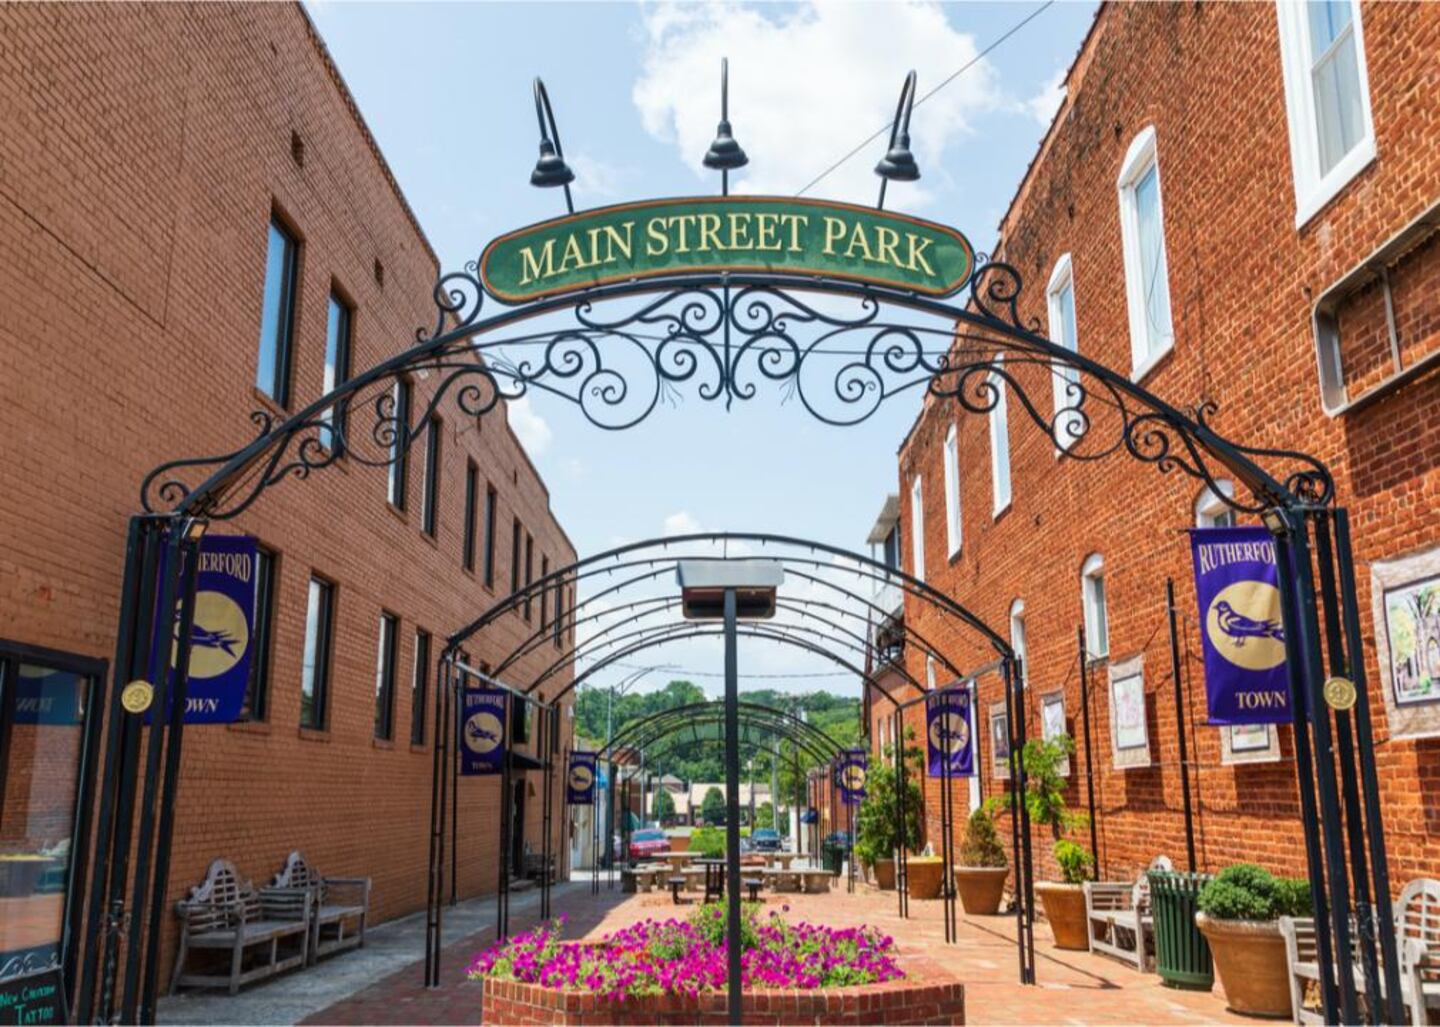
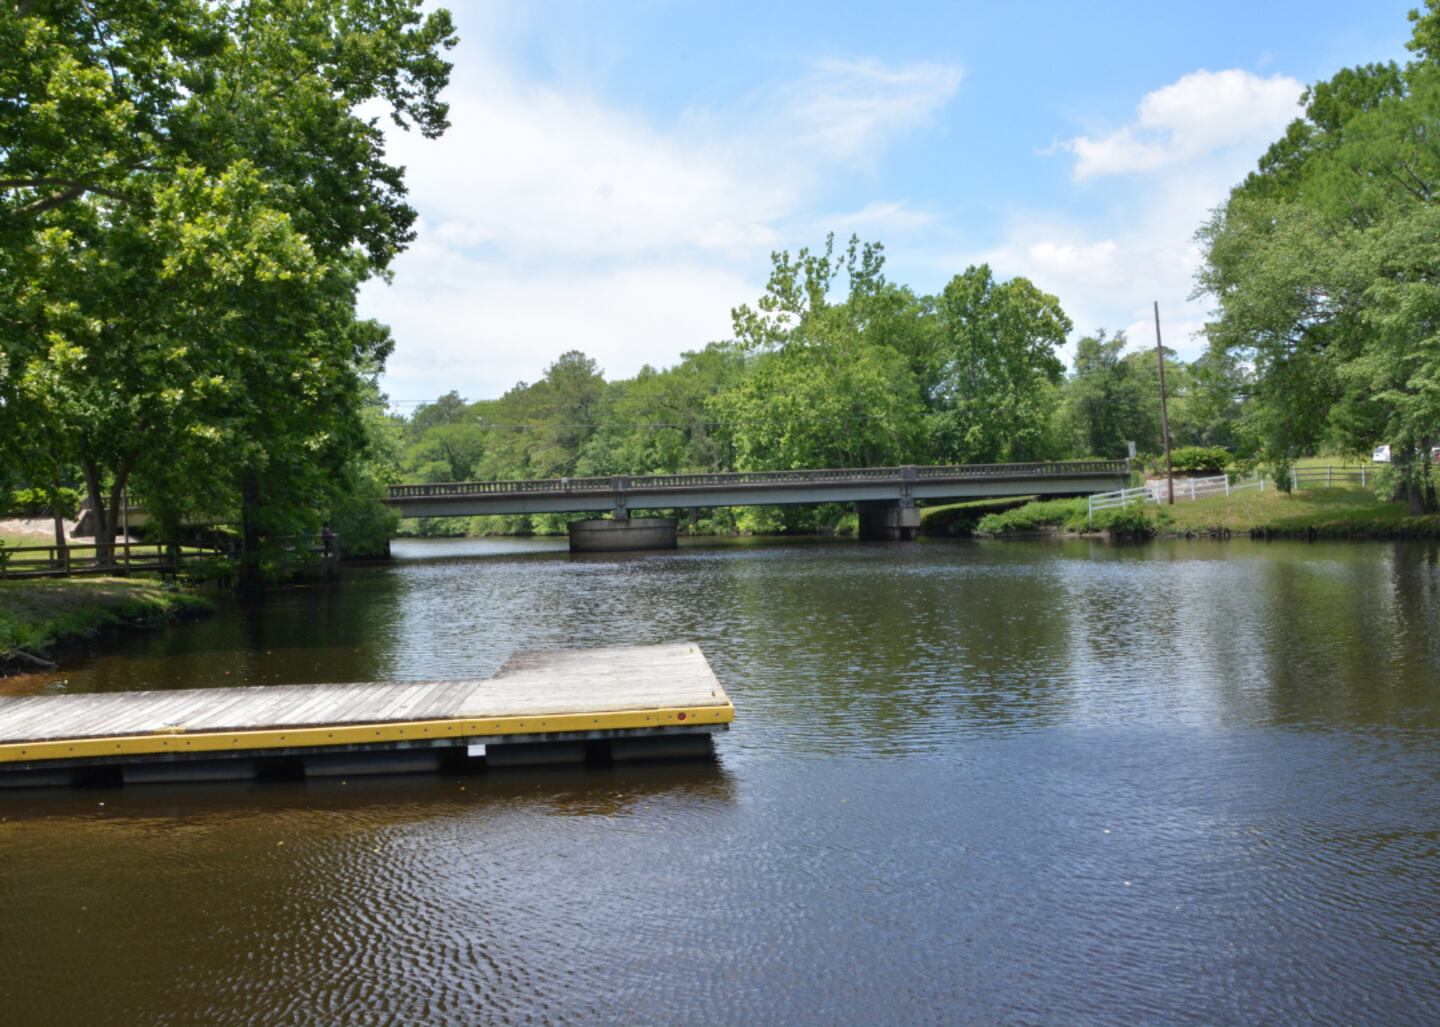
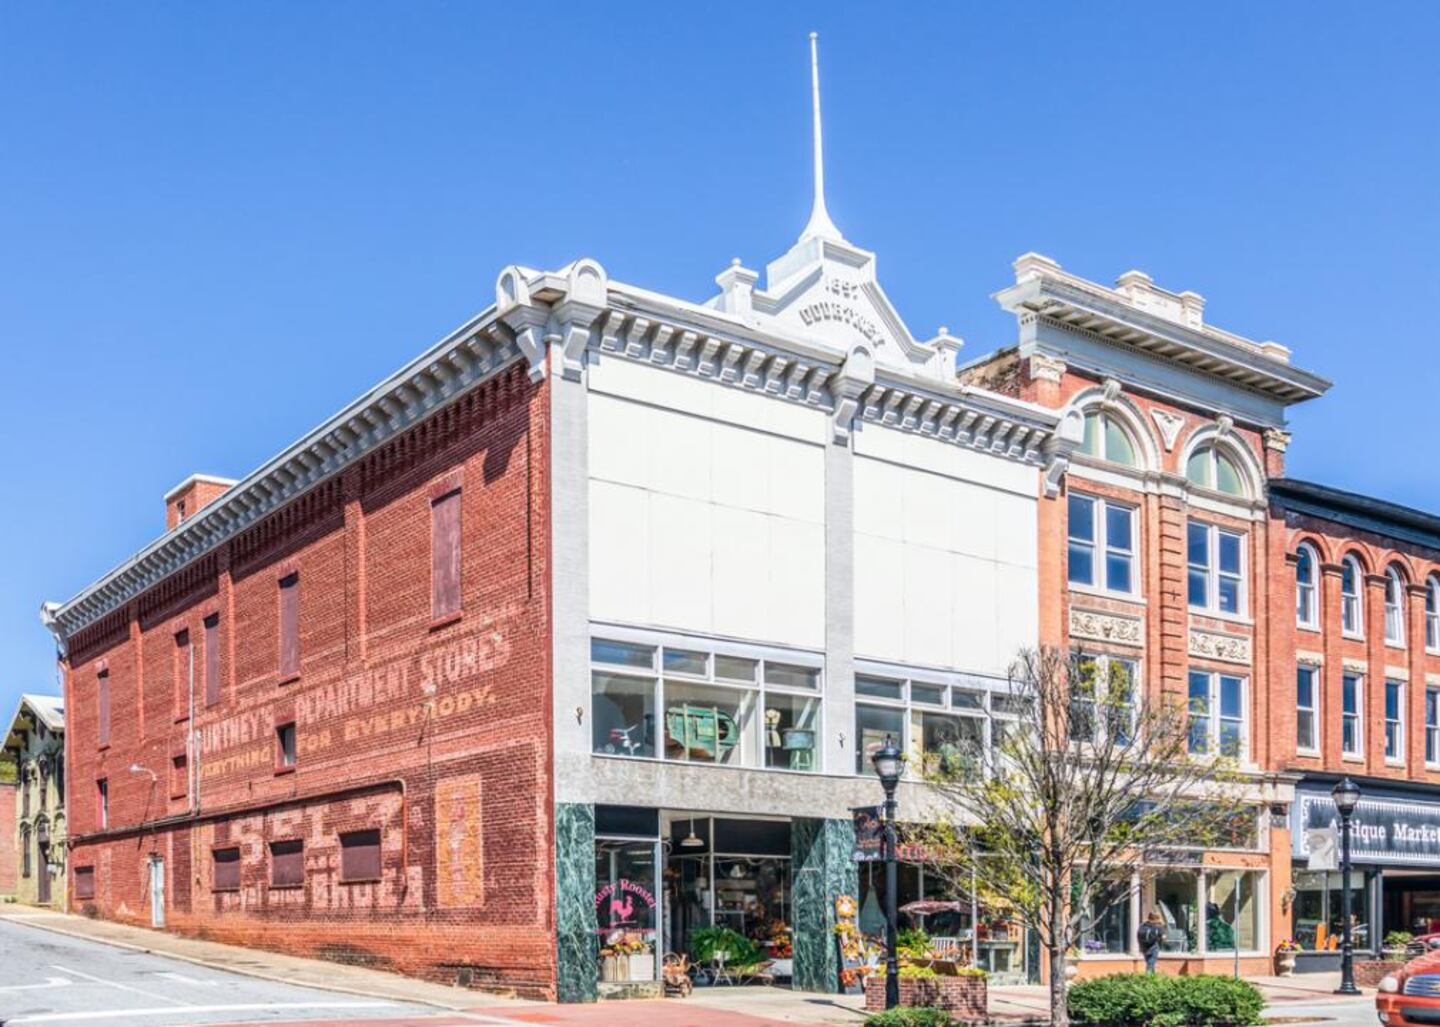
Nolichuckyjake // Shutterstock
#19. Rutherford County (tie)
- Life expectancy: 73.4 years
--- 3.2 years lower than the state average
Nolichuckyjake // Shutterstock
#19. Caldwell County (tie)
- Life expectancy: 73.4 years
--- 3.2 years lower than the state average

SevenMaps // Shutterstock
#18. Hertford County
- Life expectancy: 73.3 years
--- 3.3 years lower than the state average
refrina // Shutterstock
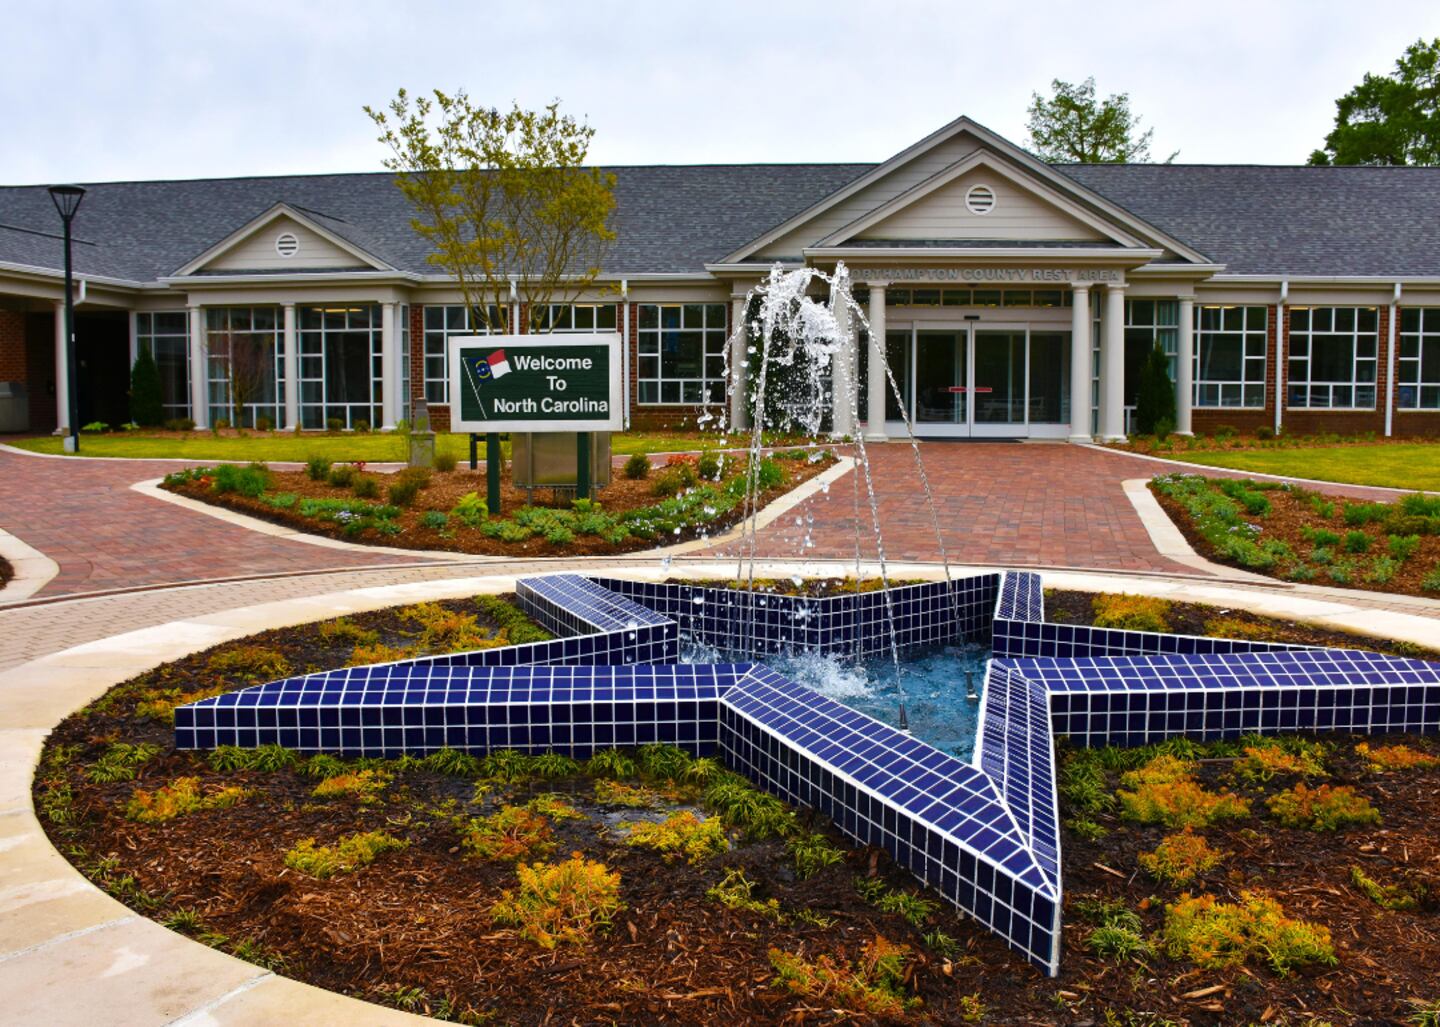
#17. Northampton County
- Life expectancy: 73.2 years
--- 3.4 years lower than the state average
Noemia Poole // Shutterstock
#16. Montgomery County
- Life expectancy: 73.1 years
--- 3.5 years lower than the state average
Canva
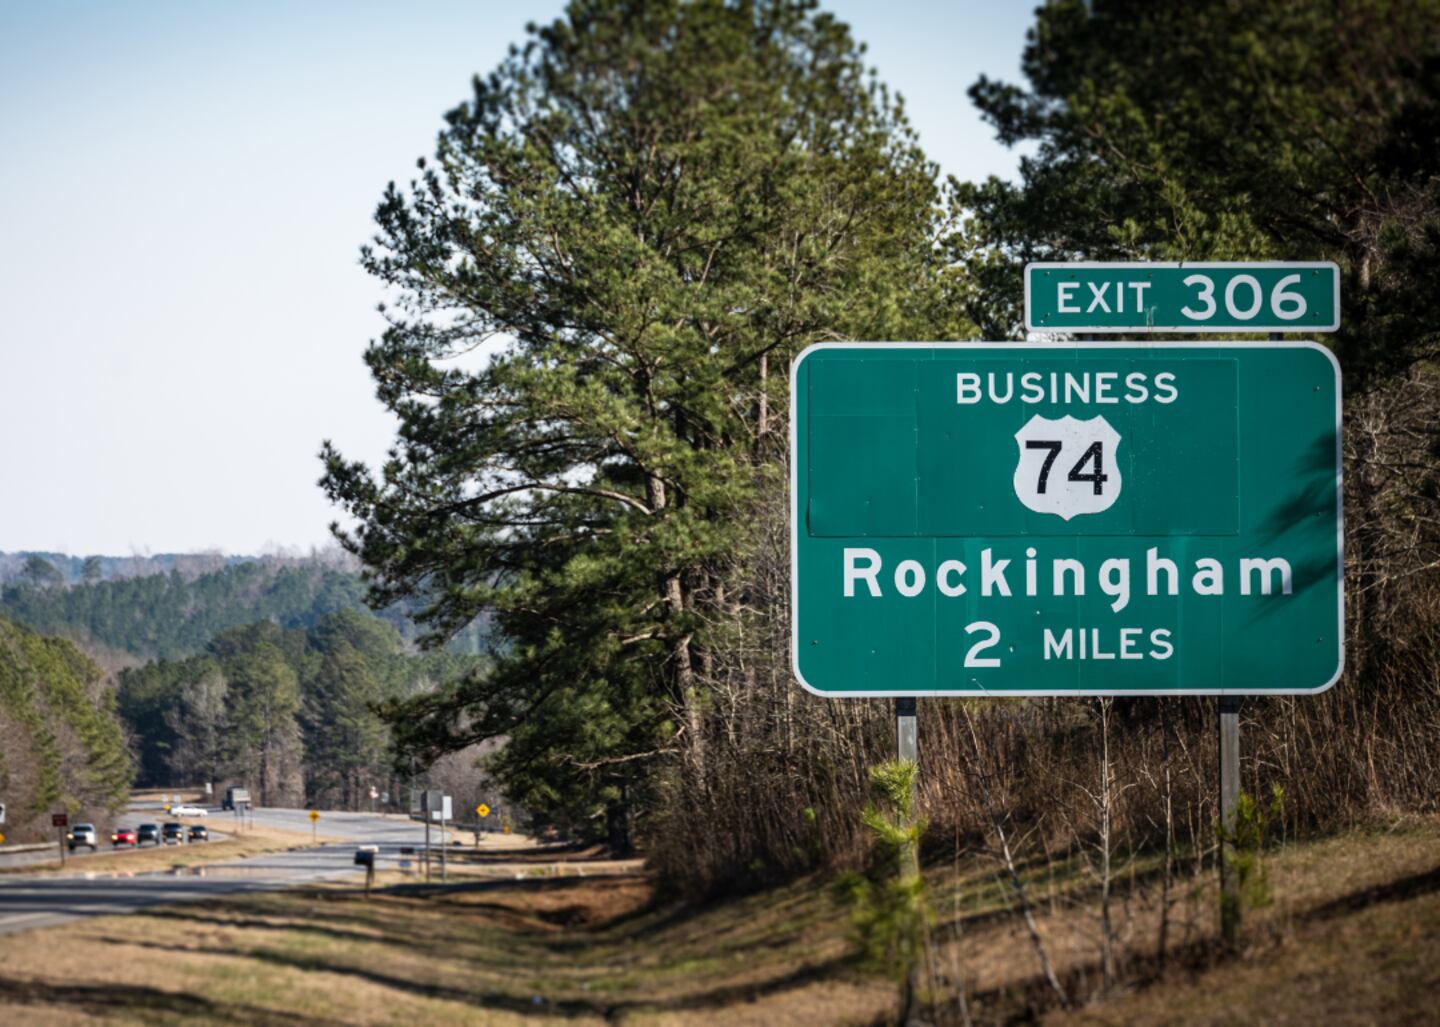
#14. Rockingham County (tie)
- Life expectancy: 72.7 years
--- 3.9 years lower than the state average
Canva
#14. Cleveland County (tie)
- Life expectancy: 72.7 years
--- 3.9 years lower than the state average

D Guest Smith // Shutterstock
#13. Martin County
- Life expectancy: 72.4 years
--- 4.2 years lower than the state average

Nolichuckyjake // Shutterstock
#12. Vance County
- Life expectancy: 71.9 years
--- 4.7 years lower than the state average
Canva
#11. Anson County
- Life expectancy: 71.8 years
--- 4.8 years lower than the state average

tjewell041810 // Shutterstock
#9. Lenoir County (tie)
- Life expectancy: 71.7 years
--- 4.9 years lower than the state average

Chansak Joe // Shutterstock
#9. Bladen County (tie)
- Life expectancy: 71.7 years
--- 4.9 years lower than the state average
D Guest Smith // Shutterstock
#8. Washington County
- Life expectancy: 71.5 years
--- 5.1 years lower than the state average
Canva
#6. Edgecombe County (tie)
- Life expectancy: 71.2 years
--- 5.4 years lower than the state average

Canva
#6. Halifax County (tie)
- Life expectancy: 71.2 years
--- 5.4 years lower than the state average
Ruth McNeill Photography // Shutterstock
#5. Scotland County
- Life expectancy: 71.0 years
--- 5.6 years lower than the state average
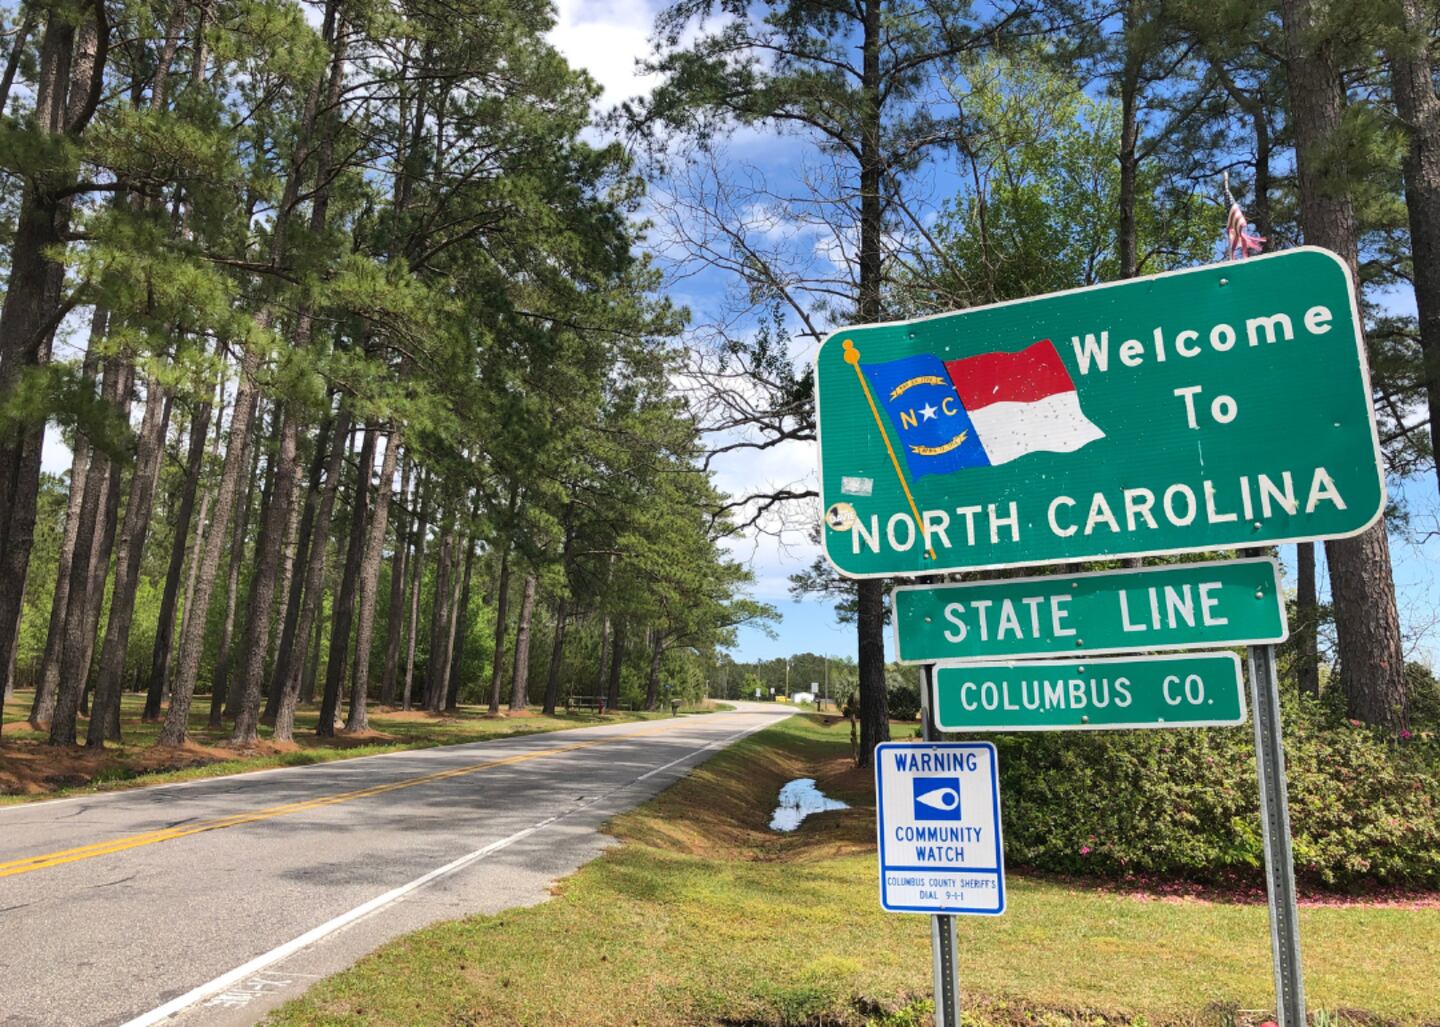
StacieStauffSmith Photos // Shutterstock
#4. Columbus County
- Life expectancy: 70.7 years
--- 5.9 years lower than the state average
Darwin Brandis // Shutterstock
#3. Richmond County
- Life expectancy: 70.5 years
--- 6.1 years lower than the state average
Canva
#1. Robeson County (tie)
- Life expectancy: 69.3 years
--- 7.3 years lower than the state average
Canva
#1. Swain County (tie)
- Life expectancy: 69.3 years
--- 7.3 years lower than the state average
This story features data reporting by Karim Noorani, writing by Kiersten Hickman, and is part of a series utilizing data automation across 49 states.
/cloudfront-us-east-1.images.arcpublishing.com/cmg/LH3JSJEF3VBLRJLJQESEAG34AM.png)


